Degrees of Latitude
by Margaret Pritchard
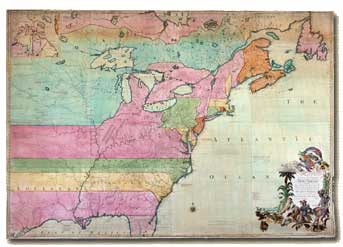
John Mitchell’s 1775 map shows British colonies extending indefinitely west, overriding rival French claims.
- Hans Lorenz
Maps tell the story of how Europeans took possession of the New World and exploited its bounty. From the outset, land and its location prefigured the economic success of every colonization enterprise. The obvious way to assert ownership over land and impose order on territories was by marking boundaries on charts and globes. The lines delineated royal claims based on discovery and exploration, the chartered possessions of companies of private investors, and the personal holdings of the wealthy. Maps tell us what the owners knew or believed about the land, suggest how explorers traveled and traded, and record routes across oceans and continents.
Recognizing the roles of maps in the lives of American colonists, Colonial Williamsburg early acquired examples to exhibit in its historic buildings and, later, in its museums. More recent studies have refined what we know about them.
Analyzing newspaper advertisements, custom orders for goods that affluent provincials placed with London merchants, household inventories, and wills provides insight about preferred geographic materials, how maps were displayed, and the regard colonists had for them. The research focused on the inspiration behind the production of maps, charts, and atlases; what they reveal about the nation’s history; and what made them important to their owners. The culmination is a book and a traveling exhibition, the book named Degrees of Latitude: Mapping Colonial America and the exhibit Maps of America from the Colonial Williamsburg Collection. Anna Glen Vietor of New York City underwrote the volume, as well as acquisition of important maps, in memory of her husband, Alexander Orr Vietor. The exhibition, to open October 1, 2002, at the New York Historical Society, also commemorates Colonial Williamsburg’s seventy-fifth anniversary.
The Degrees of Latitude efforts go beyond standard cartobibliographical analysis to provide a cultural context for the manufacture and use of objects that represented, functionally and symbolically, the expanding worldview of the enlightened colonial elite. Where people chose to display maps suggests their importance as utilitarian objects and symbols of social and political aspirations. Maps often were specified for halls, generally the most visible space in the home. An advertisement for Edward Moseley’s map of North Carolina in a 1737 Virginia Gazette said it was “a very large Map, (being Five Feet long, and Four Feet broad, on Two Sheets of Elephant Paper) it’s not only Useful, but Ornamental, for Gentlemens Halls, Parlours, or Stair-cases.” In such spaces they prominently reflected the owner’s global interest and his familiarity with such intellectual pursuits as geography, mathematics, and physics.
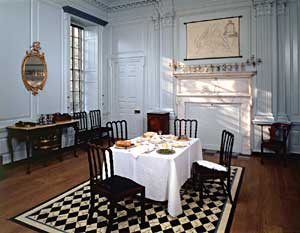
Patrick Henry’s father, John, made the Virginia map that Lord Botetourt hung in the Governor’s Palace dining room. It may be that his excellency used its placement to show subtle sympathy for the colonials.
- Tom Green
Maps were shown on dining room walls, as well. Graham Hood, Colonial Williamsburg’s retired vice president for collections and museums and Carlisle H. Humelsine Curator, believed the Governor’s Palace dining room likely was “the intellectual center of the house and the setting of cultural interaction between governor and gentry.” In 1770, Lord Botetourt hung over its fireplace a new map of Virginia drawn by John Henry. It is likely that he chose Henry’s map for that space, rather than the better-regarded work of Joshua Fry and Peter Jefferson, as a diplomatic show of support for the Virginians during a time of mounting tension between the royal government and its American colonies. A few years earlier, Henry’s son, Patrick, had been the moving force behind the resolves against the Stamp Act.
The motives for the production of many of the early maps of America—for example, to claim land—are as important as where and how colonists used them. Several English colonies were formed from grants made by the monarch to favorites. Maryland, for one, was established in 1632 after Charles I ceded a large tract to Cecil Calvert, Lord Baltimore. The success of these colonies depended on the proprietor’s ability to attract investors who would purchase parcels of real estate and supply laboring settlers and tenants. Incentives were offered through promotional pamphlets describing the richness and resources of the land and the potential for economic success. To accompany his solicitation, Baltimore commissioned a map, Noua Terræ-Mariæ tabula, to illustrate his grant. Early maps such as this figured in the seemingly endless controversies over boundaries. Careless wording of geographical limits in the charters, combined with insufficient knowledge of the terrain, led to years of litigation between Maryland and Pennsylvania, disputes not adequately resolved until Charles Mason and Jeremiah Dixon delivered their completed survey in 1768.
Maps also shaped economic development. The Chesapeake Bay and its tributaries provided an internal system of transportation that let planters send goods to market efficiently and conveniently. The mouths of the rivers that flow into the bay are broad and free of reefs, but they contain shoals and spits that challenged navigators. Maps showed ship captains in these waters where to steer clear.
As the Middle Colonies expanded west, they still relied on these water routes for trade. To avoid the high costs of freightage over an inadequate road system, farmers in central Maryland and Pennsylvania shipped produce to Baltimore by way of the Susquehanna River, which empties into the Chesapeake, which leads to the Atlantic. Thus, Baltimore became a major port by the 1750s.
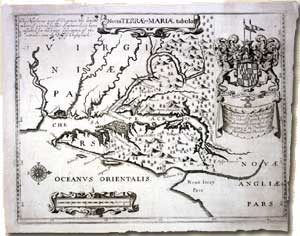
In 1671, Lord Baltimore commissioned this map to help attract investors and bring settlers and tenants to his new Maryland colony. John Ogilby was the mapmaker.
- Hans Lorenz
Philadelphia merchants believed that the profit of Baltimore’s commerce with western Pennsylvania, primarily its trade in grain, rightfully belonged to them. To recoup the lost revenue, a group of Philadelphia merchants began to study construction of a canal between the Chesapeake and Delaware Bays—an efficient route from western Pennsylvania and Maryland to Philadelphia via the Susquehanna. A Map of the Peninsula Between Delaware &c Chesopeak Bays by John Churchman supported proposals for the project. No attempt was made to construct a canal until early in the next century, but it is apparent that Churchman used his mapmaking skills to sway public opinion in its favor.
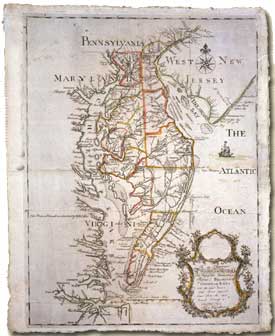
John Churchman’s circa-1779 map supported merchants’ proposals to build a canal between the Chesapeake and Delaware Bays.
- Hans Lorenz
By the middle of the eighteenth century, friction between Great Britain and France over control of North America created a need for maps to substantiate their positions. Published in 1755, John Mitchell’s Map of the British and French Dominions in North America with the Roads, Distances, Limits and Extent of the Settlements is one of the most important cartographic efforts of the 1700s. Mitchell carefully researched and depicted the boundaries of Britain’s colonies as established by their charters, showing that English claims overrode French encroachments beyond the mountains.
Control of the Ohio Valley was critical. The Ohio River gave the French the only inland passage from Canada to the lower Mississippi. The English feared that if the French were allowed to dominate that territory, English settlements would be restricted to the seaboard. Both countries began constructing forts in the area.
Maps were essential in planning campaigns during the war that followed. On July 3, 1754, seven hundred French soldiers and three hundred fifty Indians from present-day Pittsburgh, attacked Virginia militia colonel George Washington’s post, Fort Necessity, at Great Meadows. Outnumbered, Washington and his men surrendered, and he signed articles of capitulation under which British captains Jacob Van Braam and Robert Stobo were taken as captives to Fort Duquesne. During his imprisonment, Stobo studied the layout of the outpost in detail. With the help of an Indian, he smuggled out to Washington notes and a sketch suggesting how the British could take the stronghold. Stobo’s Plan of Fort Le Quesne was engraved and published in London the following year.
Maps also recorded battles. A Prospective Plan of the Battle fought near Lake George by Samuel Blodget depicts Sir William Johnson’s expedition to Fort Frederick on Lake Champlain. It was the first engraving produced in the colonies that illustrated an American battle plan.
En route to Fort Frederick, Johnson’s troops were ambushed by the French, who had been forewarned of their approach. As the English troops marched down the road, the hidden French fired on them, as illustrated in a bird’s-eye view in the Plan. Blodget wrote that the enemy “became invisible to our Men, by Squatting below the under-growth of Shrubs, and Brakes, or by concealing themselves behind the Trees.” Suffering heavy losses, Johnson’s troops retreated and barricaded themselves.
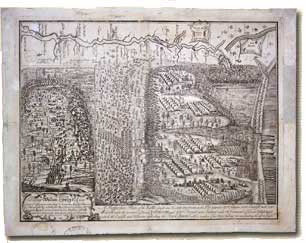
The 1755 “prospective plan” depicts the Battle of Lake George, fought that year between French and Indian forces and British and colonial troops.
- Hans Lorenz
Later that day, the French advanced to Lake George. The British knew that their regular formations, “drawn up in Order, and beginning their Fire in Platoons,” were ineffective on the frontier and “went into the Indian Way of Fighting, squatting below the Shrubs, or placing themselves behind the Trees.” The French approached and fired from three lines, also shown in the Plan. As each line discharged, its soldiers moved to the rear. More than two hundred sixty French soldiers were casualties. The British regarded it as a victory; within four months of the battle, the Plan was advertised for sale in American newspapers.
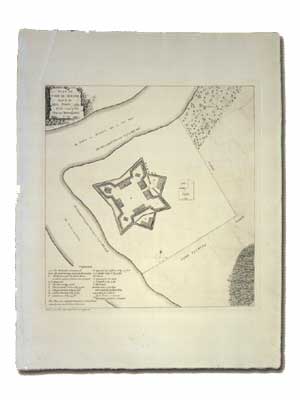
A plan of Fort Le Quesne, at present-day Pittsburgh. After French and Indian forces from this fort defeated George Washington’s militia in 1754, a prisoner from the battle supplied the mapmaker with the details of its defenses.
- Hans Lorenz
Military maps were also propaganda tools. Carte de la Partie de la Virginie depicts a dramatic, somewhat stylized version of the French navy’s role in the American victory at Yorktown. Designed for the French market, the map illustrates—and perhaps enhances—the French fleet’s position at the mouth of the Chesapeake.
On August 14, 1781, Washington, now commander-in-chief of the Continental Army, got news that shaped strategy for the remainder of the Revolution. French Admiral François Joseph Paul, comte de Grasse, had left the West Indies for the Chesapeake with a fleet of twenty-eight ships of the line, six frigates, and three thousand troops. To take advantage of de Grasse’s support, Washington and his French counterpart, Jean Baptiste Donatien de Vimeur, comte de Rochambeau, marched their combined armies almost five hundred miles to Virginia, where General Lord Charles Cornwallis, commander of a British army, had encamped at Yorktown. Washington and Rochambeau also persuaded Admiral Jacques-Melchior Saint-Laurent, comte de Barras, commander of the French fleet at Newport, Rhode Island, to sail to the Chesapeake with French siege artillery and army supplies.
De Grasse reached the Chesapeake on August 26. Posting guard ships at the mouths of the James and York Rivers to block supplies for Cornwallis, de Grasse disembarked his troops and prepared transport ships to sail up the bay to collect the allied army bound for Virginia’s Tidewater. When the British navy stationed at New York, commanded by Rear Admiral Thomas Graves, appeared at the Virginia Capes on September 5 to relieve Cornwallis, de Grasse dispatched his warships. Although the battle lasted less than three hours, the British fleet was heavily damaged. Six of Graves’s nineteen ships were temporarily taken out of action. Meanwhile, Barras slipped unnoticed into the Chesapeake with French siege artillery to pound the English entrenched at Yorktown. On September 14, Graves gave up hope of renewing the battle and ordered the British to return to New York. His fleet is pictured in Carte de la Partie de la Virginie as it prepared to sail. Cornwallis, as the map so clearly shows, was trapped.
The 1783 Treaty of Paris ended the Revolutionary War and granted the United States the land between the Allegheny Mountains and the Mississippi River, encouraging American expansion. A system for state mapping was needed. Few state governments could fund the survey and publication of maps of their counties and boundaries, so, with the exception of New York, the first state maps were privately compiled and printed. By 1840, government agencies and private companies were establishing mapping programs. Though the accuracy of maps depicting the United States exceeded the previous century’s, the cartography lacks much of the visual and psychological appeal of the early renditions of America.
But as a body of historic documents, whether they trace the discovery and settlement of the New World or its development, maps are tools for understanding America’s past.
Margaret Pritchard is Colonial Williamsburg’s curator of prints, maps, and wallpaper. Collaborating with Willie Graham, she contributed to the winter 1995/96 journal “Rethinking the Brush-Everard and George Wythe Houses.”
For further study:
Purchase Degrees of Latitude: Mapping Colonial America by Margaret Pritchard